Can’t sleep because you’re on your phone? You’re not alone! We dug into user behavior and device profiles to see how consumers connect, what devices are most popular, and more. We’ve organized all of this information in one handy infographic!
With one of the largest in-app presences amongst the 1,000 apps on the App Store and Google Play, we’re able to surmise a lot about general user behavior and trends just by looking at ad requests.
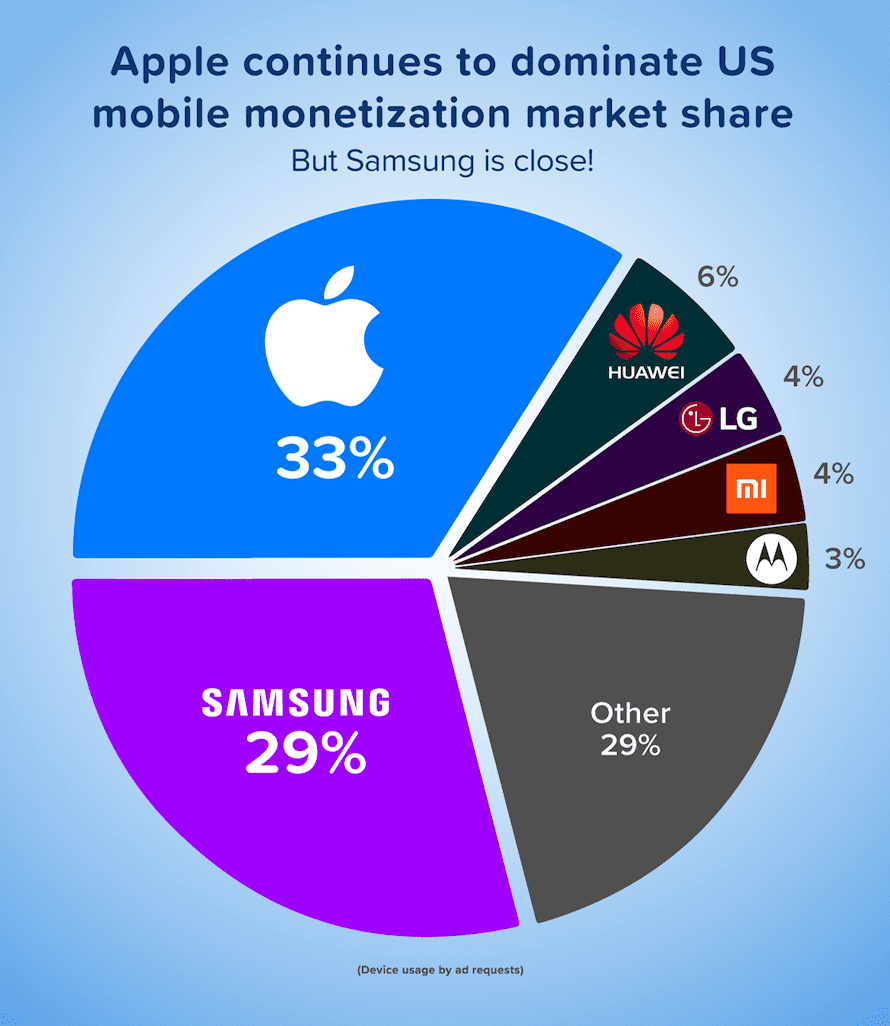
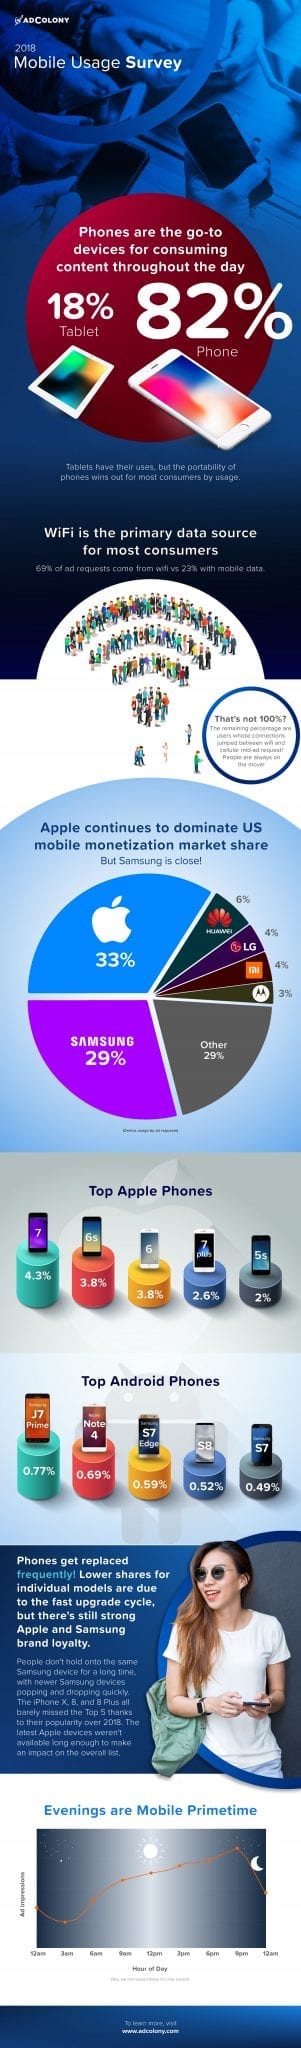
The Device Landscape is in Flux!
Apple continues to be the largest single manufacturer on our network, but Samsung isn’t far behind! Strong demand for the latest devices keeps both Samsung and Apple as the two largest players. Huawei, LG, and even Xiaomi Redmi make up a sizable percentage.
The iPhone X and iPhone 8, released last year, didn’t crack the top 5 of our devices but grew a lot over the year. The iPhone 8 finished 6th and the iPhone X at 7th. The 8 Plus fit between them. Samsung’s strength in number was pushed by the J7 Prime, a device popular with pay-as-you-go and flexible carriers like Metro by T-Mobile (formerly MetroPCS).
While it’s too soon to see the impact of the iPhone XS or iPhone XR, it’s clear that many consumers are using and monetizing on older devices. The iPhone 5S and Samsung Galaxy S7, released in 2013 and 2016 respectively, both had strong showings for monetization, as did the iPhone 6S and 6.
One other trend we noticed when comparing device requests over time was how quickly new Android devices popped up. The Xiaomi Redmi Note 4 came virtually out of nowhere in Q2 with a huge portion of Android requests total, to take the second-most used Android device overall, but dropped out of the top 10 Android devices by Q3, with devices like the Vivo 1610 and Motorola Moto G, and scores of cheaper Samsung devices rising up.
Incentives by carriers to get a new phone likely push these new cheap devices up and down, but Google’s simple device-to-device setting and upgrade process makes the whole thing much less of a headache for users.
Evenings are Mobile Primetime
Once people wake up in the morning, mobile device usage rises steadily as the day goes on. The rise sharpens a bit as people get home from school (3pm) and again after work (6pm). Usage continues to climb until 9pm, when it begins to decline as users get ready to head to bed.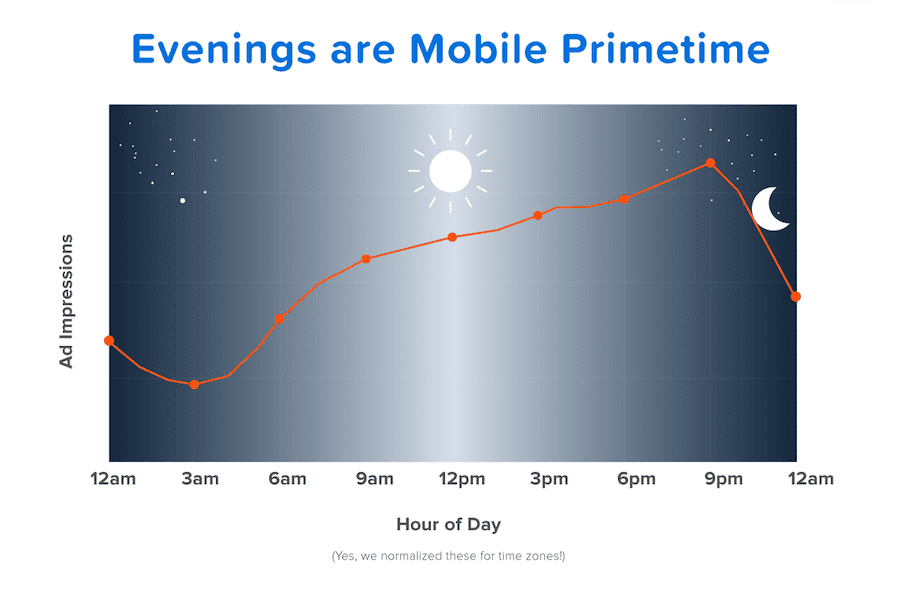 There’s oodles of information on how consumers are engaging with their devices in the full infographic, including connectivity method, additional device breakdowns, and more.
Check out the whole infographic below (click for the full-size version!):
About the Data
All figures and data were sourced from the AdColony platform from April through September 2018. Activity and engagement were gauged on ad requests received by ads using the AdColony SDK. All ad requests were analyzed in aggregate and contain no identifying information for individuals.
Join the Conversation
How often are you on wifi vs LTE? How late are you staying up on your phone? Tweet us at @AdColony. For the latest AdColony mobile news and updates, follow @AdColony on Twitter, like us on Facebook, or connect on Linkedin.

- Effectively Scaling Apps – The Myth of the Whale Busted - May 17, 2022
- How to Maximize and Optimize Engagement in Your App - May 5, 2022
- Offer Walls for App Monetization: Everything You Ever Wanted to Know - April 14, 2022